World Happiness and Freedom Index
Motivation
This project investigates the impact of economic, social, and political factors on human perceptions of freedom and happiness. Using the data, we attempt to identify clusters of countries that are alike. For example, we can look for countries where people have restricted freedoms but are happy, or we can look for countries where people have a lot of freedom but aren't happy (an anarchy-like state).
Data
Data is available to us through two sources that are freely available on the Internet. Our first source is the Human Freedom Index, a compendium of measures of human civil, economic, and personal freedoms. It is a yearly report compiled by three research institutions, Cato Institute, Fraser Institute, and Friedrich Naumann Foundation for Freedom, across the globe since 2015. The dataset includes 119 total measures of both personal freedoms (such as criminal justice, access to Internet, freedom of religion) and economic freedoms (such as tax rate, property rights, inflation).
Our second source is the World Happiness Report, a survey of the state of global happiness released by the United Nations yearly since 2012. The report uses data from the Gallup World Poll, which surveys nationally representative samples of people, then determines a final score and rank for each country. The countries are scored on seven factors:
We combine the two data sources by merging by their common countries (of which there are 64 without any missing data), focusing on 120 features (eliminating duplicate ones), and the years 2015-2016.
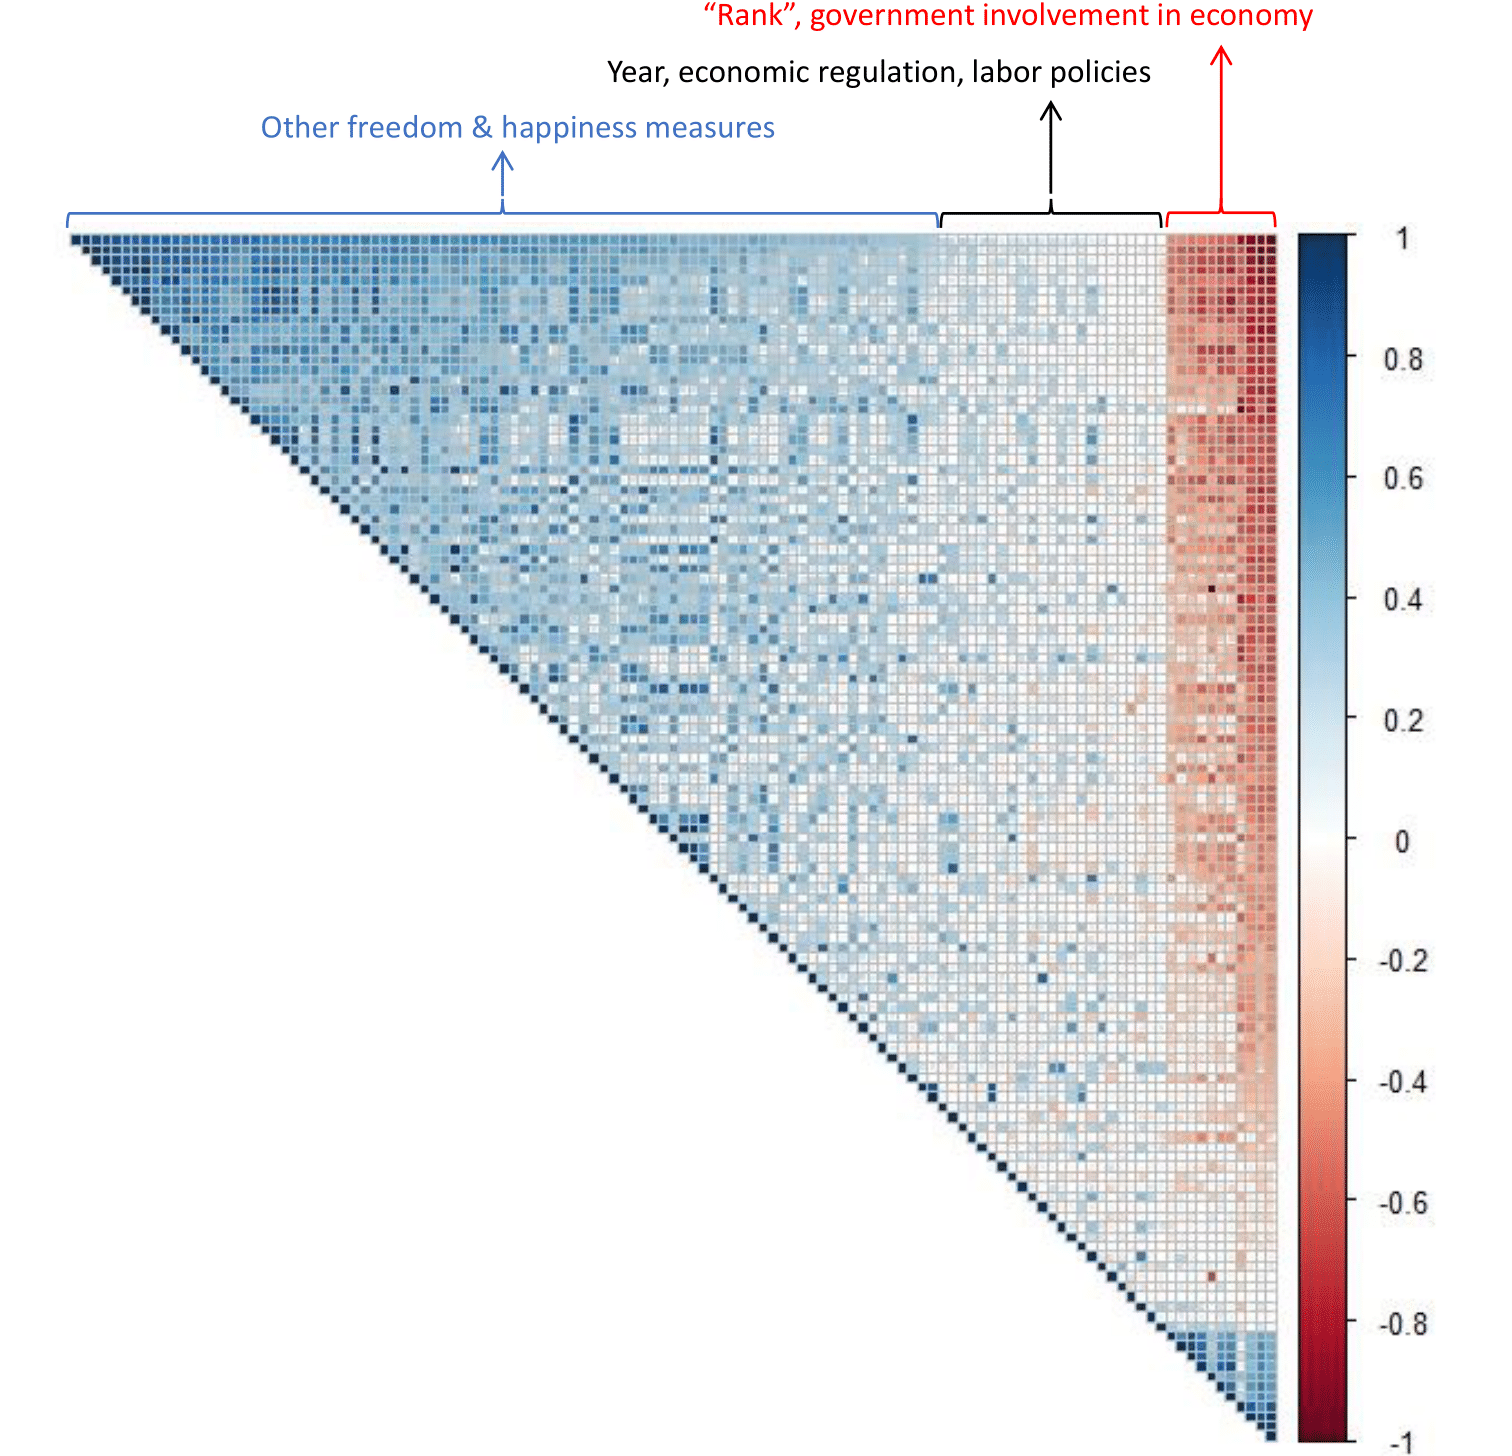
Since we have p = 120 variables, it is difficult to analyze each feature individually. Instead, we can plot a correlation plot, which helps us visualize clusters of features that are similar to each other.
Dimension Reduction
We employ both dimension reduction methods as well as clustering methods to identify subgroups of countries which are similar to each other.
LASSO Regression
We use LASSO regression to identify statistically significant variables using human freedom score and happiness score as dependent variables. We run the algorithm separately, once with freedom as the dependent variable, and once with happiness, using cross-validation to identify the optimal shrinkage value. Combining the results of both regressions, the significant variables were reduced from 120 down to 8.
t-Distributed Stochastic Neighbor Embedding
t-Distributed Stochastic Neighbor Embedding (t-SNE) is a non-linear dimension reduction method, and also our last method of that kind. While PCA is linear and has difficulty representing complex polynomial relationships between features, t-SNE is able to represent high-dimensional data on a non-linear, low dimensional manifold.
t-SNE uses conditional probabilities to represent similarities between datapoints. Specifically, the similarity of datapoint xj to xi is the conditional probability xi would pick xj as its neighbor, in proportion to their probability density under a Gaussian centered at xi.
t-SNE returns a low-dimension matrix Y, called the embedding matrix, which minimizes the sum of these differences in conditional probabilities.
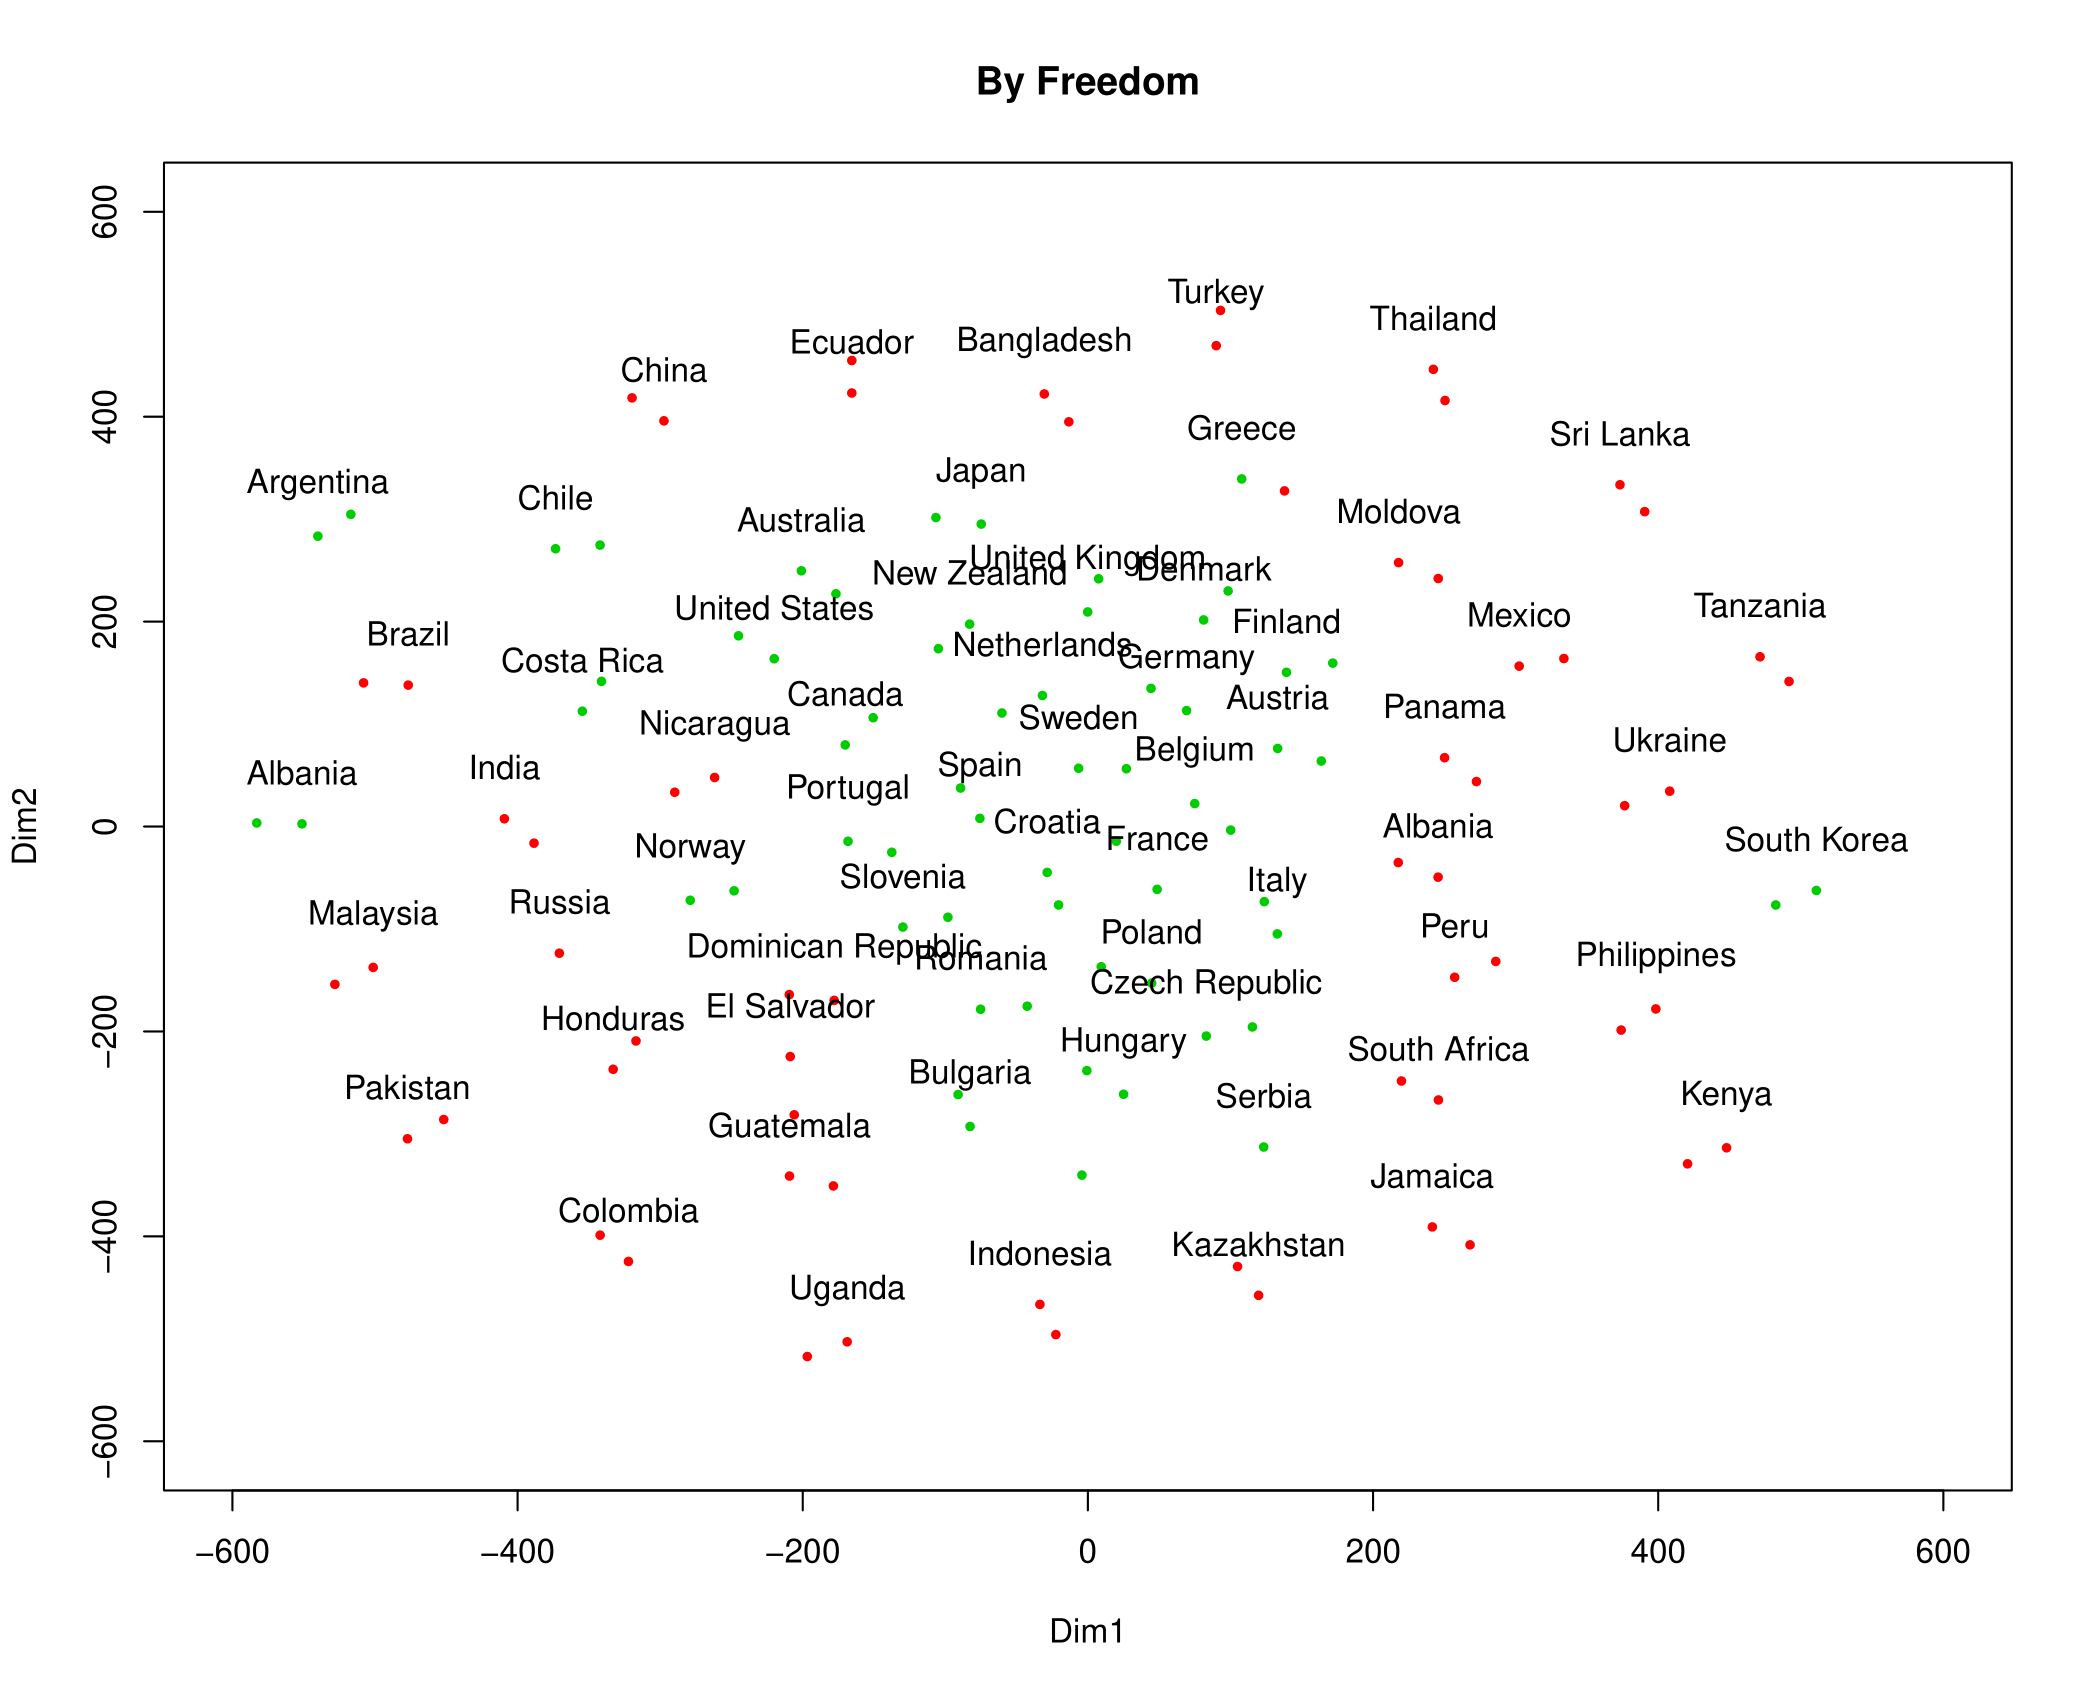
It is interesting to note that most points comes in a pair. This is because we have data for each country from two consecutive years, 2015 and 2016. The statistics for the same country are very similar between 2015 and 2016, so it is natural that these points are very near each other.
Principal Components Analysis
We used PCA as another dimension reduction method. For visualization purposes, we projected the data onto the first two principal components, i.e.\ largest two eigenvectors. These two components explained 44% of the variance in the dataset.
Clustering
K-Means
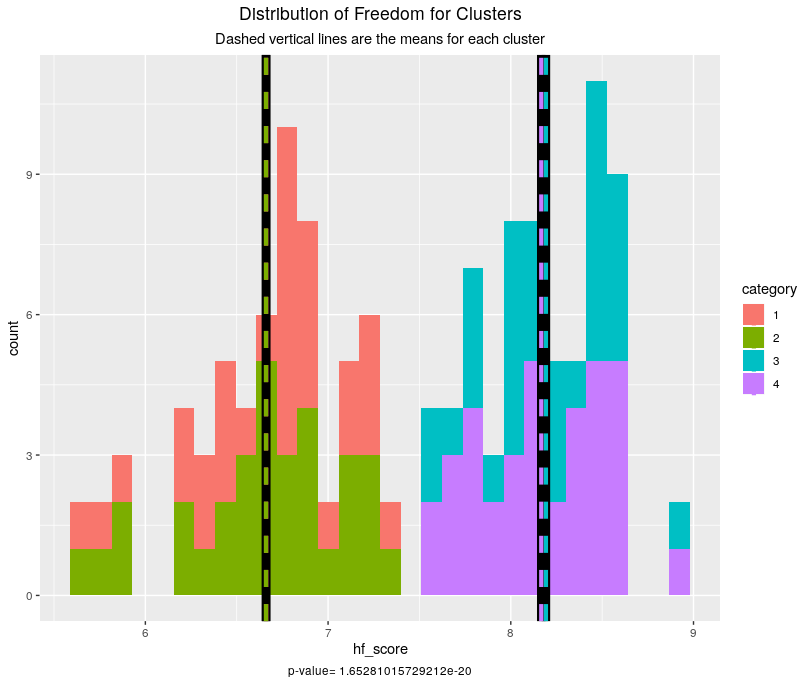
With K = 4, the BSS/TSS (between sum-of-squares divided bytotal sum-of-squares, interpreted as the amount of variance explained by the clustering so generallythe higher the better) is 64.9%, making it the best fit so far for the raw data. It is interesting to note that, while happiness still has horrible separation, freedom is very well separated into two clusters of countries with lower than the median score and two clusters with above themedian score.
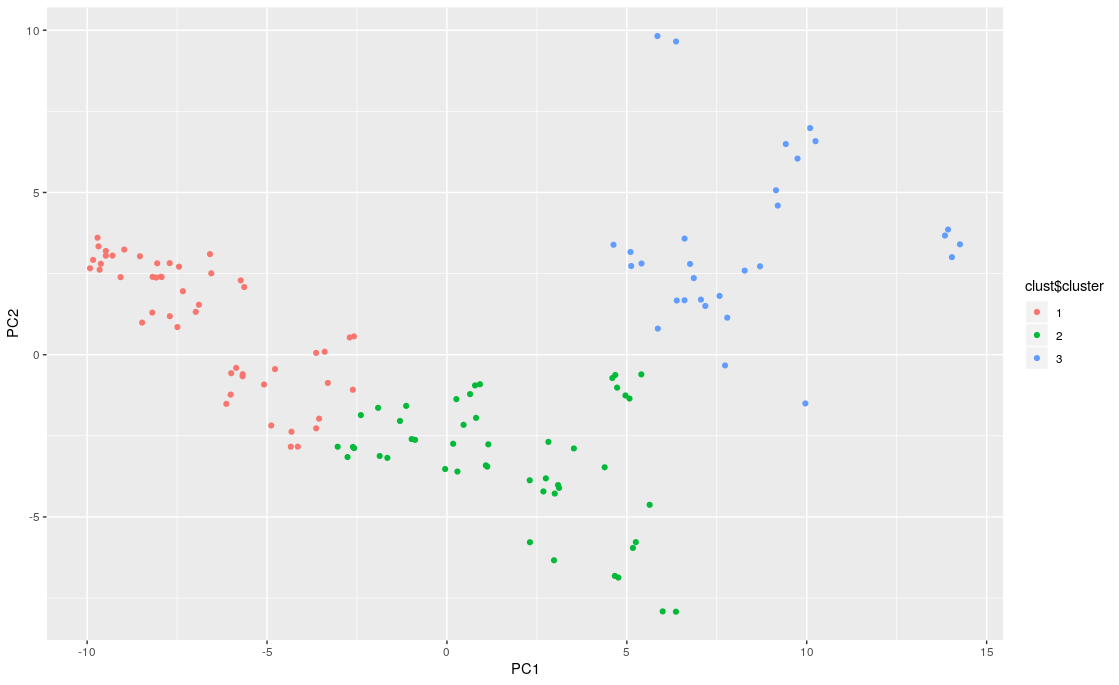
We also performed K-means on the results of PCA, using only the first two principal components for visualization and simplicity. Again the decision of the optimal number of clusters was left to the elbow method, with the optimal K = 3.
Hierarchical Clustering
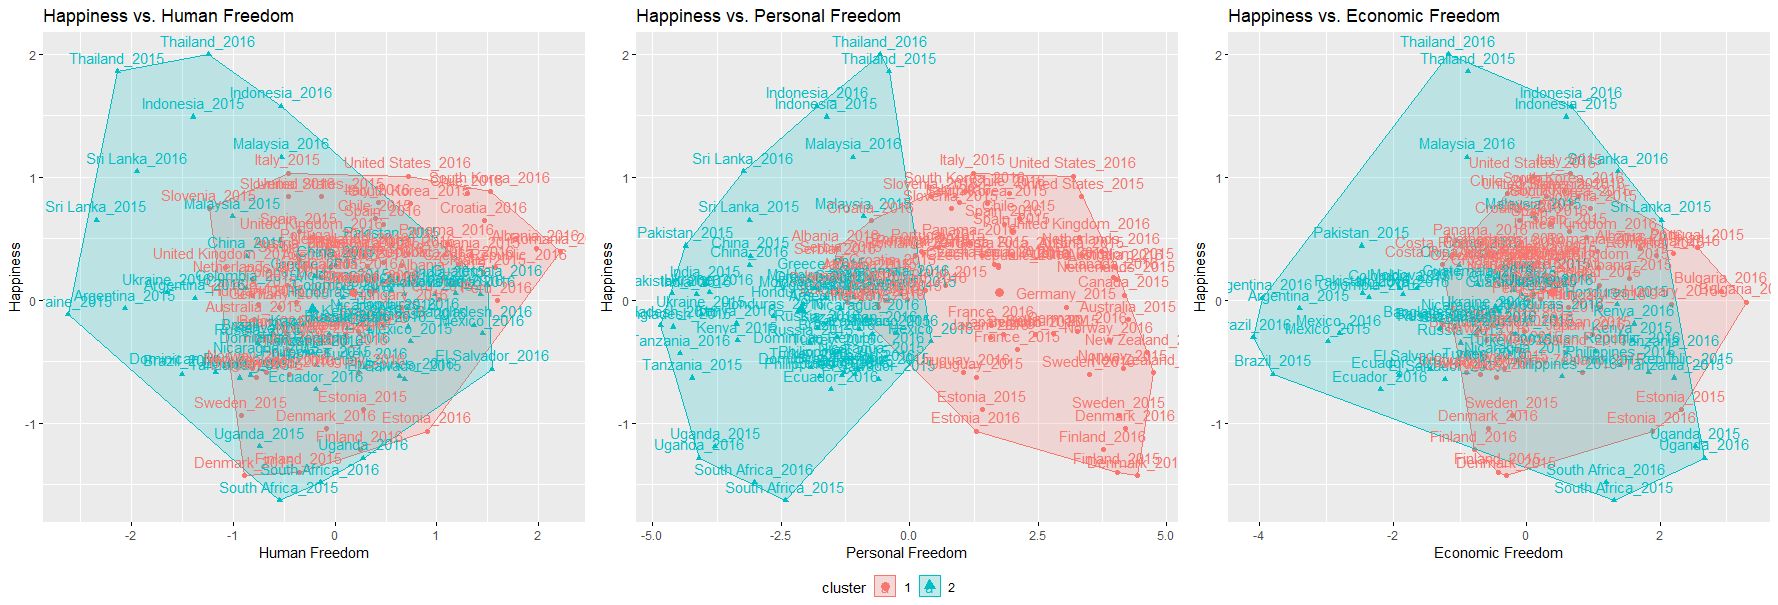
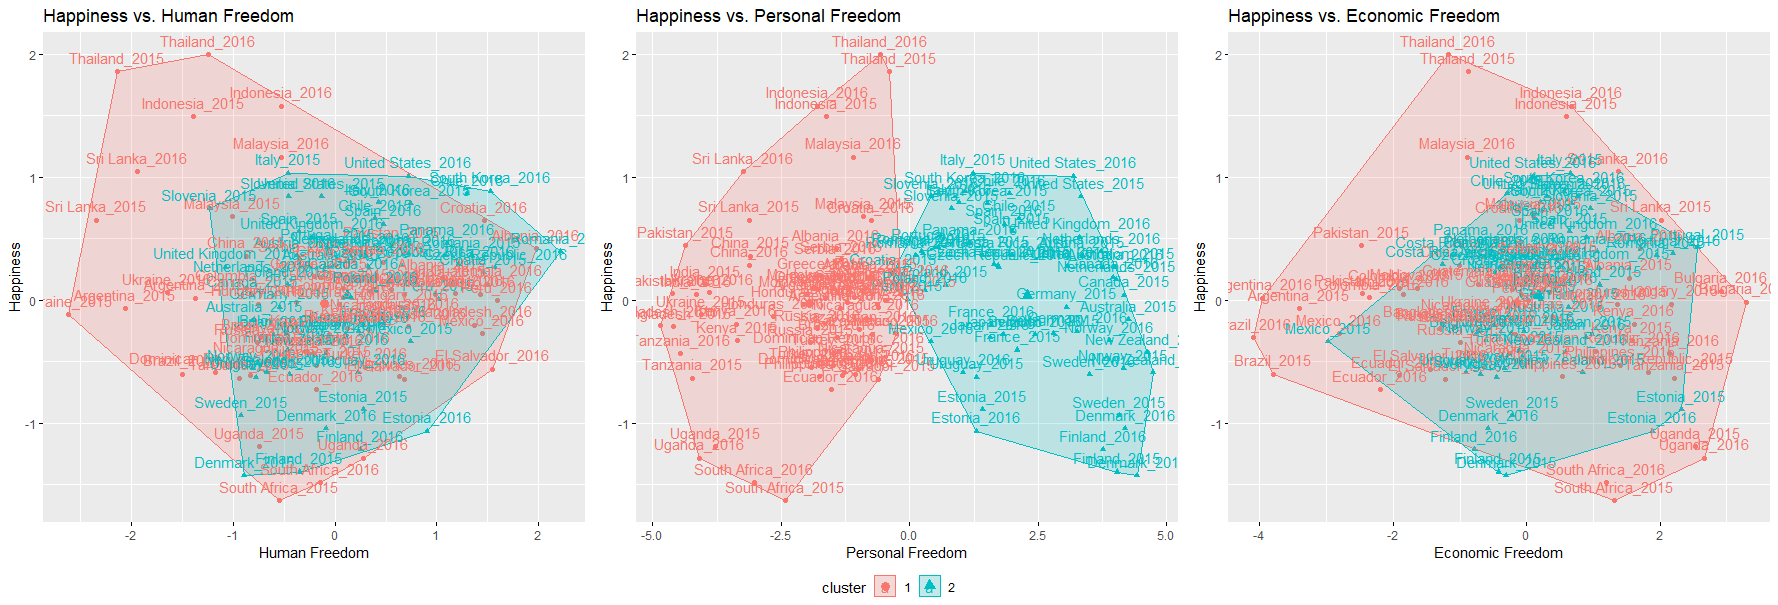
Another clustering method we tried was hierarchical clustering, using both the agglomerative (bottom-up clustering, each datapoint begins as a singleton cluster) and divisive (top-down clustering, all datapoints begin in a single large cluster) methods on the scaled significant variables from LASSO. Euclidean distance was selected as the dissimilarity measure.
We can observe the results of both hierarchical clusterings on 2D Euclidean space:
Linear Discriminant Analysis (LDA)
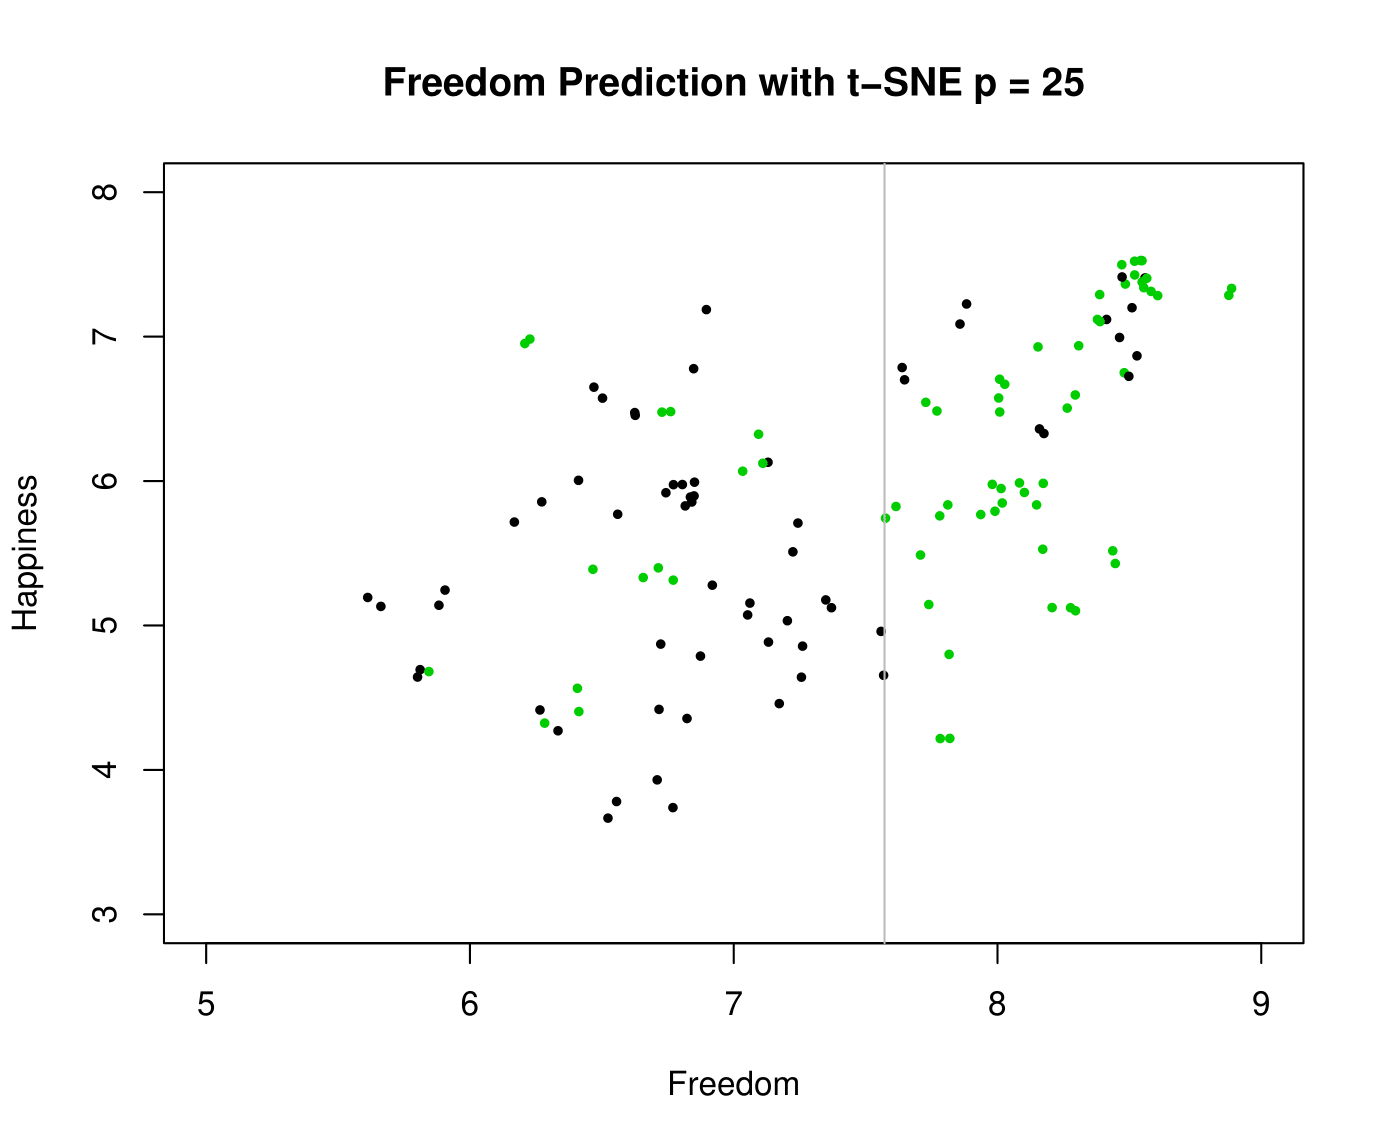
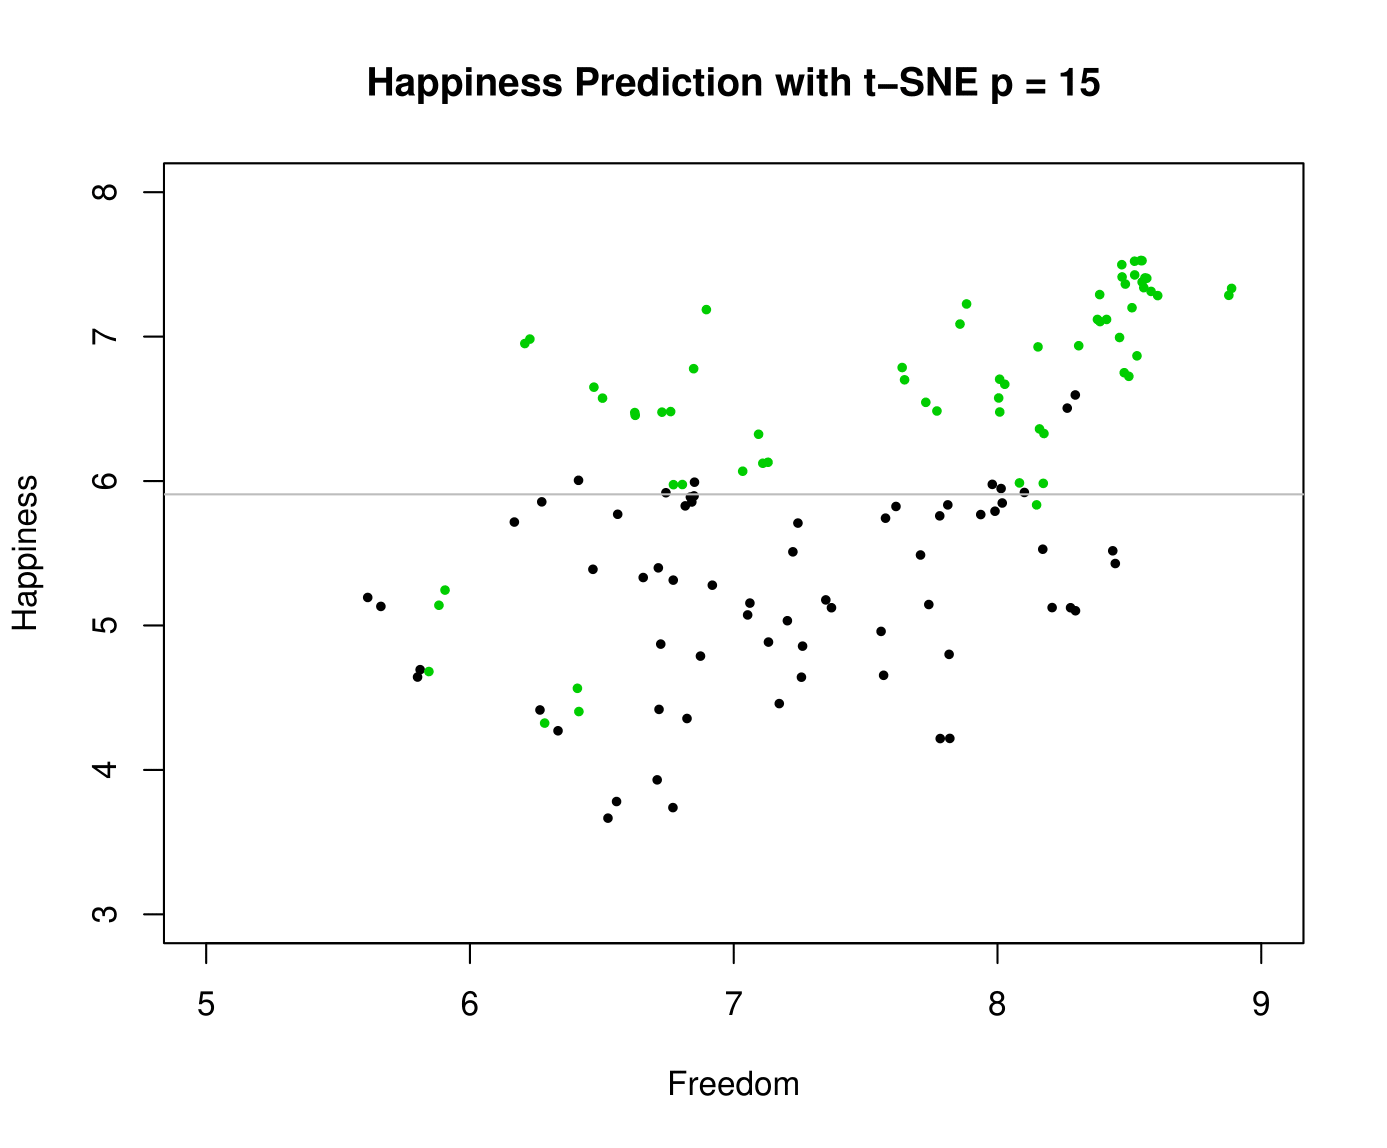
In this section we apply a method that is very similar to clustering: classification and prediction. We use linear discriminant analysis (LDA) to find a linear combination of features that separates two (or more) classes of data, similar to ANOVA or logistic regression.
At first, running LDA on the raw dataset does not work, as there are too many correlated variables resulting in multicollinearity. To get around this issue, we can first do dimension reduction via t-SNE and then run LDA on the results.
Conclusions
From running three different methods of dimension reduction/variable selection (PCA, t-SNE, and LASSO), each performed vastly different functions. It is unclear which method is strictly the best; likely each method has its own merits depending on the final problem to be solved.
Our three clustering methods also produced drastically different results. Our original question was whether a natural clustering would shine light on clear differences over the happiness and freedom levels of each individual country. With K-means, happiness was not very well separated and had significant overlap between clusters. Hierarchical clustering represented a new way of thinking about the clustering problem as a whole. With this method, freedom score had a very clean separation with minimal overlap. Like K-means, the separation for happiness was much poorer. The final method, LDA, is less clustering and more classification. With the help of t-SNE, relatively good classification accuracy was achieved on the Happiness classes. However, unlike the other two clustering methods, separation was much more difficult for freedom.

